Investment Newsletter Using Spinoffs & Other Strategies To Beat The Market For 9 Straight Years Investment Newsletter Using Spinoffs & Other Strategies To Beat The Market For 9 Straight Years Investment Newsletter Using Spinoffs & Other Strategies To Beat The Market For 9 Straight Years Investment Newsletter Using Spinoffs & Other Strategies To Beat The Market For 9 Straight Years  
Home        
Performance of Our Portfolios
Current Articles
Current Recommendations (Subscribers Only)
How It Works
FAQs
Investing 101
About us
Contact Us
Subscribe
 

Why Mutual Fund Expense Ratios Matter. How 0.5% In Higher Fees Can Cost You $25,000

12/23/03 Do you ever check your mutual fund’s expense ratios? Well, you should because one study shows that there’s an 89% chance that your funds will under-perform if their expense ratios are above average. We'll also show you that switching to a fund with an expense ratio that is 0.5% lower than your current fund can save you $25,000 or more over time.

Standard & Poor’s recently did a study that showed that "on average, funds with lower expense ratios have outperformed their more expensive peers in eight out of the nine domestic fund style categories over a one, three, five, and ten-year annualized basis." In other words, 89% of the time, funds with expense ratios lower than their peers outperform those with higher expense ratios. A lower expense ratio does not guarantee better performance, but the study shows that choosing funds with low expense ratios increases your odds of success. And isn't investing all about putting the odds in your favor?

But let’s just ignore the fact that funds with lower expense ratios tend to outperform those with high expense ratios. Let’s assume that we have two funds that perform the same before expenses, but one has an expense ratio of 1.5% and the other has an expense ratio of 1.0%. What kind of difference can a half of one percent make? Over time it can make a big difference.

As an example, let’s assume $50,000 is invested in the two mutual funds for ten years. The fund with the lower expense ratio would have earned over $5,000 more. After twenty years, the difference grows to nearly $25,000. An amount equal to almost one half of your initial investment would be saved with the mutual fund with the lower expense ratio. So who says a lousy half a percent doesn't amount to anything?
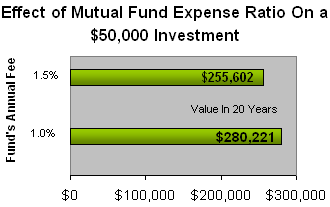
 

Expense Ratios Just 0.5% Lower Can Save You $25,000 Over Time


Don’t compare apples to oranges.

One thing to keep in mind is that you must compare mutual fund expense ratios with other mutual funds in the same category. This is because some types of mutual funds (such as international stock funds) will almost always have higher expense ratios than other types of funds (such as index funds). Just make sure to compare index funds versus other index funds and international funds versus other international funds.

So how do you find out if the mutual funds you are interested in have expense ratios lower than their peers? With the Internet, it's easy. You could go to Yahoo Finance’s mutual fund “Profile” pages or Morningstar.com ‘s “Fees & Expenses” section for the funds in question. Because web pages may change over time, just drop us a line if you have trouble locating this information. We'll quickly point you in the right direction because we are very familiar with this type of analysis. It’s just one of the many characteristics we look for when searching for the mutual funds to recommend to the subscribers of our investment newsletter.

-Rex M. Jacobsen
Sr. Editor

This article may be re-published as long as the following resource box is included at the end of the article and as long as you link to the URL mentioned in the resource box:

Article by Rex M. Jacobsen, Sr. Editor of the investment newsletter Beat The Stock Market.com. Since 1998, the company's model portfolio has achieved a return of 31.9% per year. The company's web site can be found at http://www.BeatTheStockMarket.com.


(Log-In -- Log-Out)

News About Recommended Stocks, Mutual Funds, & Events on Wall St.
(Complete Article List)

11/18/2024

Dividend-Growth Stock Portfolio: Weekly Investments (as featured on YouTube)

More>>

11/18/2024

High-Yield Stock Portfolio: Weekly Investments (as featured on YouTube)

More>>

11/17/2024

Weekly Video Update: +34.12% Annual Return for High-Yield Stock Portfolio, Beating S&P 500 (Dividend-Growth Stock Portfolio +21.18% per Year, also beating the S&P 500) -- Week 150 Update

More>>

11/11/2024

Buy/Sell Signals for Hi-Div Blue Chip Stock Portfolio: Buying Financial Stalwart & Selling Portfolio Member for +76% Total Return

More>>

11/11/2024

Dividend-Growth Stock Portfolio: Weekly Investments (as featured on YouTube)

More>>

11/11/2024

High-Yield Stock Portfolio: Weekly Investments (as featured on YouTube)

More>>

11/10/2024

Weekly Video Update: +35.73% Annual Return for High-Yield Stock Portfolio, Beating S&P 500 (Dividend-Growth Stock Portfolio +22.59% per Year) -- Week 149 Update

More>>

11/08/2024

Millennial Money Portfolio Stock Screen: Monthly Update

More>>

11/08/2024

Trending Value Portfolio Stock Screen: Monthly Update

More>>

11/08/2024

Consumer Staples Stock Screen: Monthly Update

More>>

11/04/2024

Dividend-Growth Stock Portfolio: Weekly Investments (as featured on YouTube)

More>>

11/04/2024

High-Yield Stock Portfolio: Weekly Investments (as featured on YouTube)

More>>

11/03/2024

Weekly Video Update: +30.14% Annual Return for High-Yield Stock Portfolio, Beating S&P 500 (Dividend-Growth Stock Portfolio +19.58% per Year) -- Week 148 Update

More>>

10/28/2024

Dividend-Growth Stock Portfolio: Weekly Investments (as featured on YouTube)

More>>

10/28/2024

High-Yield Stock Portfolio: Weekly Investments (as featured on YouTube)

More>>

10/27/2024

Weekly Video: +31.09% Annual Return for High-Yield Stock Portfolio, Beating S&P 500 (Dividend-Growth Stock Portfolio +20.41% per Year) -- Week 147 Update

More>>

10/21/2024

High-Yield Stock Portfolio: Weekly Investments (as featured on YouTube)

More>>

10/21/2024

Dividend-Growth Stock Portfolio: Weekly Investments (as featured on YouTube)

More>>

10/20/2024

Weekly Video: +37.39% Annual Return for High-Yield Stock Portfolio, Beating S&P 500 (Dividend-Growth Stock Portfolio +22.48% per Year) Week 146 Update

More>>

10/14/2024

High-Yield Stock Portfolio: Weekly Investments (as featured on YouTube)

More>>

10/14/2024

Dividend-Growth Stock Portfolio: Weekly Investments (as featured on YouTube)

More>>

10/13/2024

Weekly Video: Dividend-Stock Portfolio Beating SCHD & S&P 500, +31.92% per year - Tech-Stock Portfolio +49% Annualized Return - Week 145 Update

More>>

10/10/2024

Millennial Money Portfolio Stock Screen: Monthly Update

More>>

10/10/2024

Trending Value Portfolio Stock Screen: Monthly Update

More>>

10/10/2024

Consumer Staples Stock Screen: Monthly Update

More>>

10/07/2024

High-Yield Stock Portfolio: Weekly Investments (as featured on YouTube)

More>>

10/07/2024

Dividend-Growth Stock Portfolio: Weekly Investments (as featured on YouTube)

More>>

10/06/2024

Weekly Video: +34.37% Annual Return High-Yield Stock Portfolio, Beating S&P 500 (Dividend-Growth +21.20%) - Week 144 Update

More>>

09/30/2024

High-Yield Stock Portfolio: Weekly Investments (as featured on YouTube)

More>>

09/30/2024

Dividend-Growth Stock Portfolio: Weekly Investments (as featured on YouTube)

More>>

09/29/2024

Weekly Video: +33.79% Annual Return High-Yield Stock Portfolio, Beating S&P 500 (Dividend-Growth +21.80%) - Week 143

More>>

Go to full article list